This post demonstrates how to use margins and benchmarks in financial statements for a CPG or consumer product business.
Margins Defined
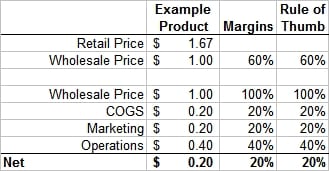
By margins, I mean an expense line item that is relative to net profit, expressed in percentage. Figure 1 is a basic example with the key margins to which we will pay attention.
Figure 1 – Margins in a Product Business
In this example, I made numbers equal to the rules of thumb. In general, wholesale price to a retailer is 60% of shelf-price. This will vary across retail channels, but on average, it’s 60%. The wholesale price is the gross revenue to the manufacturer, whereas the retail price is the gross revenue to the retailer. The retailer pockets the difference between retail price and wholesale price. COGS, marketing and operations rule of thumbs are 20%, 20% and 40%, respectively. Again, these vary across industry and company, but if you don’t know them for your industry, these benchmarks are a good place to start.
Example of a Pre-Launch Phase Company
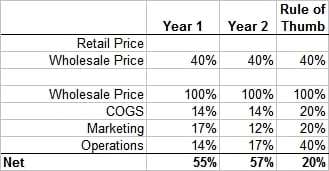
Figure 2 is one example of a product business in the pre-launch phase. A detailed set of financial projections are working behind the scenes to arrive at these margins. Investment costs are separated out, as explained in more detail here.
Figure 2 – Product business in pre-launch phase
The expense margins are lower than average, especially the operations number and marketing in year 2. We have to ask: Are the expense and/or revenue assumptions wrong? Is the spreadsheet not making accurate calculations? are there advantages that the business is able to leverage to reduce the expenses? Or, is this the norm for the industry? In this specific case, the business is projecting its ability to leverage certain advantages to reduce costs and the industry tends to have lower expense margins and a much higher net. This could be a great business with room to make errors in the expenses because there is lots of margin to play with.


